How will the breakeven point change? Break-Even Point: Calculation Formulas and Control Methods
When thinking about starting a business, an entrepreneur must understand how long it will take to cover costs, and from what moment income will begin to flow. The break-even point is the mark after which the business should become really profitable. Without determining this point, it is impossible to predict the payback of the project and assess the prospects, so the decision to invest without reasonable forecasts for the development of a particular business is usually not made.
What is a break-even point
The break-even point in the English abbreviation is BEP (break-evenpoint), for convenience we will use this designation. Assuming that profit is the difference between TR (totalrevenue) and TC (totalcost), BEP can be defined as the point of zero profit. BEP can be in cash or in kind. This indicator needs to be known in order to navigate the sales volumes to reach zero. In BEP, expenses are always less than income. If the point is crossed, they talk about income and, accordingly, before it is reached, about losses.
You need to know about a company's BEP in order to draw reasonable conclusions about its financial stability. By increasing the value of BEP, you can be sure that there are problems with profit. The change in value occurs with the growth of the enterprise with a concomitant increase in turnover, when entering another sales network, when prices change and the network is established.
You need to know the BEP value for:
- Determining the prospects for investing in a project, taking into account a specific sales volume.
- Identification of company issues due to temporary BEP changes.
- Calculation of the interdependence of sales volume and the price of the product produced.
- Finding out a possible decrease in revenue without the threat of losses, if the actual profit received exceeds the calculated one.
Fixed and variable costs
To determine BEP, you need to separate fixed and variable costs.
Fixed costs:
- deductions for depreciation;
- salaries of management personnel;
- rent, etc.
Variable costs:
- Consumables;
- accessories;
- fuels and lubricants;
- electricity;
- workers' wages, etc.
Fixed costs are not affected by the volume of production and the level of sales. These costs remain unchanged for a long time, and they can be affected by an increase or decrease in productivity, the opening or closing of sites, changes in rent, inflation, etc. The size of variable costs directly depends on the volume of production (sales). As volume increases, variable costs increase. It is important to understand that the cost of each unit of production is conditionally fixed and does not depend on the volume of production.
BEP Calculation
Break-even is calculated by cost or in kind.
1. To calculate BEP in physical terms, you need the following data:
- FC (fixedcost) - fixed costs per volume.
- P (price) – unit price;
- AVC (averagevariablecost) - variable costs per unit.
Formula for calculation in physical terms:
BEP = FC / (P − AVC)
2. Calculation of BEP in monetary terms is made:
- FC (fixed cost) - fixed costs;
- TR (totalrevnue) - income.
- P (price) – price;
- VC (variable cost) - variable cost per volume or AVC (average variable cost) - variable cost per unit.
First, calculate the share of marginal income (MR) in the total revenue. The indicator is needed to calculate in monetary terms. Marginal income is the difference between revenue and variable costs.
The price of a unit of production is calculated by the formula
P = TR / Q, where Q is the volume of sales.
Contribution margin is the difference between unit price and variable costs.
Marginal income ratio:
KMR = MR / TR or (by price): KMR = MR / P
The results from applying both formulas are the same.
Profitability threshold or break-even point is calculated by the formula:
Let's calculate the BEP for a clothing store. Taking into account the specifics of the enterprise, we will carry out calculations in monetary terms.
Fixed expenses include:
- rent - 100,000 rubles;
- sellers' salary - 123,080 rubles;
- deductions from wages (30% - insurance premiums) - 369 20 rubles;
- utility bills - 15,000 rubles;
- advertising - 35,000 rubles.
Total: 300,000 rubles.
Store variable costs consist of:
- The average purchase price is 1,000 rubles.
- Planned sales volume, units - 600.
Total: 600,000 rubles.
Marginal income will be:
MR \u003d 2,400,000 - 600,000 \u003d 1,800,000 rubles.
Ratio MR:
KMR = 1,800,000 / 2,400,000 = 0.75
Calculate BEP:
BEP \u003d 300,000 / 0.75 \u003d 400,000 rubles.
This means that in order to reach zero profit, the store must sell goods for 400,000 rubles. Having stepped over this mark, the trading enterprise will begin to make a profit. The financial strength of the store is 1,800,000 rubles, i.e., by reducing revenue by this amount, the company will not go into losses. It is much easier to determine the break-even level using a calculator.
For the development of any type of business, it is important to understand at what point, at what volume of production or sales, the enterprise will be able to fully cover all costs, losses and begin to make a profit.
To determine this level allows the procedure for calculating the break-even point - the most important indicator of the effectiveness of any commercial project. The higher the volume of production and sales above this critical level, the more stable the financial position of the enterprise.
Characteristics and main indicators
The break-even point is a value that indicates the required volume of production or sales for the stable operation of the enterprise without making losses and profits.
 Upon reaching this point the number of costs will be equal to the value of sales, that is, both income and expenses will be at zero. Sometimes this parameter is called the critical production volume, threshold. In such a situation, the firm does not receive profit, and is only able to reimburse costs.
However, the breakeven rate makes it possible to calculate, how much you need to release products or sell, so as not to be "in the red" and work with a profit. Here there is such addiction: if this indicator is exceeded, the organization makes a profit, if it has not yet been passed, then production is unprofitable. This indicator reacts to many factors: changes in prices for raw materials, materials, increase in turnover, expansion of the dealer network, etc.
The value of the break-even point is paramount for determining the financial stability of the company, since allows:
- see the trend of business development in general;
- evaluate the attractiveness of an investment project for potential investors: payback period, risk level, etc.;
- identify problems in the enterprise if this parameter changes over time;
- plan sales for a certain period;
- understand the value of income and costs in relation to adjust prices, see which item can reduce costs;
- calculate how much it is necessary to change the volume when the price changes and vice versa; by what amount to reduce revenue so as not to roll into a loss.
Calculation algorithm
To determine this point, you need variable and fixed cost data. They must be properly separated, to understand the difference between them. Successful entrepreneurship involves a competent calculation of all the costs of maintaining a business.
variable costs may consist of the cost of raw materials, materials, semi-finished products, components, energy, fuel for production, as well as the sum of all the main workers, along with other things.
They are practically impossible to calculate in advance : they depend on the nature of the enterprise, the volume of production and can change monthly. The larger the volume of output and sales, the higher the amount of costs. Average variable costs do not change with the volume of production.
V fixed costs may include rent, depreciation deductions, the amount of salaries of administrative and management personnel along with insurance deductions, payments for, taxes, communication costs, etc.
Such costs remain constant, they do not depend on the volume of production. However, they can be influenced by changes in the capacity of the enterprise, the changing amount of rent, inflation, etc.
step by step mechanism for defining and applying Break-even points can be represented as follows:
- Collection of data to analyze the level of production volume, sales of goods, expenses and incomes;
- Calculation of the size of all costs, break-even point and security area;
- Assessment of the required level of production / sales for the financial stability of the company.
Calculation algorithm breakeven points can be:
- analytical (using special formulas);
- graphical (involves plotting a graph based on a series of basic values).
If you have not yet registered an organization, then the easiest this can be done using online services that will help you generate all the necessary documents for free: If you already have an organization and you are thinking about how to facilitate and automate accounting and reporting, then the following online services come to the rescue, which will completely replace an accountant at your plant and save a lot of money and time. All reporting is generated automatically, signed with an electronic signature and sent automatically online. It is ideal for an individual entrepreneur or LLC on the simplified tax system, UTII, PSN, TS, OSNO.
Everything happens in a few clicks, without queues and stress. Try it and you will be surprised how easy it got!
Calculation formula
 To measure the break-even point, the following are taken: indicators:
- Revenue (income).
- Fixed costs (per volume).
- Costs are variable (per volume).
- Variable average costs (per unit of output).
- Price (revenue per unit of output).
- Marginal income (the difference between revenue and variable costs).
- Margin ratio (the share of marginal income in revenue, determined by dividing variable costs by the amount of revenue).
Calculation formula in money equivalent:
Break Even Point = Revenue Fixed Costs / (Revenue – Variable Costs)
Calculation formula in in kind:
Break Even Point = Fixed Costs / (Price - Variable Average Costs)
There is also a method for determining the break-even point in monetary terms using the value marginal income:
Break Even Point = Fixed Costs / Margin Ratio
The result of the calculation according to the formulas will be the critical volume of production or sales in monetary or physical terms. Since the break-even point shows the volume of sales from which the profit comes, comparing it with other indicators (such as cost, expenses, etc.), it can be used to analyze an investment project.
What are fixed and variable costs, as well as the break-even point, see the following video tutorial:
Calculation example
Clothing store
Let's calculate the break-even point for a clothing store. Here it is better to apply the calculation in monetary terms because the range of goods and prices are different.
Initial data:
- Fixed costs (rent, salary of sellers together with deductions, payment for utilities and advertising) = 250,000 rubles.
- The purchase price of the product is average = 1000 rubles.
- Sales volume = 300 units.
- Variable costs (purchase prices of products) = 300,000 rubles.
- Revenue = 600,000 rubles.
- Marginal income \u003d Revenue - Variable costs \u003d 600,000 - 300,000 \u003d 300,000 rubles.
Margin ratio \u003d Variable costs / Revenue \u003d 0.5.
Payment:
Break-even point \u003d Revenue Fixed costs / (Revenue - Variable costs) \u003d 600,000 250,000 / (600,000 - 300,000) \u003d 500,000 rubles.
Or by another formula:
Break-even point \u003d Fixed costs / Margin ratio \u003d 250,000 / 0.5 \u003d 500,000 rubles.
In this way, store to sell goods for 500,000 rubles to cover expenses and break even. All sales above will be profitable.
For a metalworking company
 When calculating the break-even point for a metalworking enterprise, it is better to apply the formula in in kind. Small businesses often produce disposable products at roughly the same price.
Initial data:
- Fixed costs (total expenses for the enterprise, deductions for depreciation, the amount of wages of the administration together with deductions) = 250,000 rubles.
- Variable costs (funds for the purchase of raw materials and semi-finished products, the amount of wages of working personnel along with deductions, fuel and technological costs) = 300,000 rubles.
- Average variable costs (per unit of output) = 300 rubles.
- Product price (revenue per unit of production) = 500 rubles.
- Volume of production (planned) = 1000 units.
- Revenue = 500,000 rubles.
Payment:
Break even point = Fixed costs / (Price - Variable average costs) = 250000 / (500 - 300) = 1250 pieces.
In this way, enterprise will reach break-even point for the release of products in the amount of 1250 pieces for a certain period. This example shows that in order to reach the level without losses and profits, it is necessary to increase the volume of production by 250 pieces from the planned one. Further excess of the volume will bring profit.
However, the default calculation recognizes the fact that with an increase in volume, the price will remain the same, costs will also not increase, and the goods will be sold in full, without any leftovers. In reality, not everything can be so perfect.
An example of the calculation can be viewed in this video:
Graphing algorithm
When constructing this graph, do the following:
- on the horizontal axis, indicate the volume of production / sales;
- on the vertical axis, plot the values of fixed costs (straight line), variable costs (slanted line) and gross costs separately, as well as revenue.
As a result, graphs of fixed, variable and gross costs, as well as revenues, will be built. Break even located at the intersection revenue schedules and gross costs. At this point, revenue and sales are threshold or critical, the company covers all costs and receives zero profit.

Building a break-even point chart
breakeven point chart reflects change in revenue, fixed, variable and gross costs, depending on the volume of production, indicated on the percentage scale horizontally.
When constructing it, the assumption is made that sales occur evenly, prices for products and raw materials do not change over a given period.
Advantages and disadvantages of this analysis model
 Any novice entrepreneur should calculate the break-even point. This model makes it easy see the lower limit of the financial stability of a business project in order to take steps to increase the safety zone (remoteness from the critical zero profit mark). The mechanism for finding the threshold level of production and sales is quite simple and does not require any additional special knowledge.
However, it should be borne in mind that ideal conditions of production, market and labor organization are taken to determine this point. In everyday reality, the output of products and their implementation is influenced by many external factors that are difficult to predict. In particular, seasonality, fluctuations in demand, increased competition, the introduction of new technologies, and higher prices for raw materials matter, which can change sales volume. Therefore, this model is more suitable for enterprises operating in stable market conditions.
The break-even point is the critical volume of production. When the break-even point is reached, the profit, as well as the losses of the organization are equal to zero.
The break-even point is an important value in determining the financial position of the enterprise. The excess of production and sales volumes above the break-even point determines the financial stability of the enterprise.
The break-even model relies on a number of assumptions:
- the behavior of costs and revenues can be described by a linear function of one variable - the volume of output;
- variable costs and prices remain unchanged throughout the planning period;
- the structure of production does not change during the planning period;
- the behavior of fixed and variable costs can be accurately measured;
- at the end of the analyzed period, the enterprise does not have stocks of finished products (or they are insignificant), i.e. the volume of sales corresponds to the volume of production.
Using the algebraic method, the zero profit point (break-even point formula) is calculated based on the following relationship:
I = S - V - F = (p * Q) - (v * Q) - F = 0
Where, I - the amount of profit;
S - revenue;
V - total variable costs;
F - total fixed costs;
Q is the volume of production in physical terms;
v - variable costs per unit of output;
p - unit price of production (realization price).
The break-even point determines how much sales must be in order for the company to cover all its costs without making a profit. In turn, how profit grows with a change in revenue (shows operating leverage (operating leverage)).
When determining the break-even point, it is necessary to divide the costs into two components:
- Variable costs - increase in proportion to the increase in production (the volume of sales of goods);
Fixed costs - do not depend on the number of products produced (goods sold) and on whether the volume of operations is growing or falling.
The break-even point is of great importance to the lender, since he is interested in the viability of the company and its ability to pay interest on the loan and the principal amount. So, the degree of excess of sales volumes over the break-even point determines the stability margin (margin of safety) of the enterprise.
Let us introduce the notation:
B is sales revenue.
Рн - sales volume in real terms.
Zper - variable costs.
Zpost - fixed costs.
C - price per piece.
ЗСper - average variable costs (per unit of output).
Tbd - break-even point in monetary terms.
Тbn - break-even point in real terms.
Break-even point formula in monetary terms:
Tbd \u003d V * Zpost / (V - Zper)
The break-even point formula in physical terms (in units of products or goods):
Tbn \u003d Zpost / (C - ZSper)
How far is the company from the break-even point margin of safety.
Safety margin formula in monetary terms:
ZPd \u003d (B - Tbd) / B * 100%
Safety margin formula in physical terms:
ZPn \u003d (Rn - Tbn) / Rn * 100%
The margin of safety shows how much revenue or sales volume must decrease in order for the company to break even.
Margin of safety is a more objective characteristic than the break-even point. For example, the break-even points of a small store and a large supermarket can differ thousands of times, and only a margin of safety will show which of the enterprises is more stable.
Margin of financial strength shows the excess of actual sales proceeds over the profitability threshold. The larger this value, the more financially stable is p / p. Margin of financial strength shows how much you can reduce the sale (production) of products without incurring losses.
The excess of real production over the threshold of profitability is the margin of financial strength of the company:
Margin of financial strength= Revenue - Threshold of profitability.
The margin of financial strength of an enterprise is the most important indicator of the degree of financial stability. The calculation of this indicator makes it possible to assess the possibility of an additional reduction in revenue from sales of products within the break-even point.
In practice, there are three situations that will affect the amount of profit and the financial strength of the enterprise in different ways:
1) the volume of sales coincides with the volume of production;
2) the volume of sales is less than the volume of production;
3) the volume of sales is greater than the volume of production.
Both the profit and the margin of financial safety obtained with an excess of production are less than with the corresponding volume of sales to the volume of production. Therefore, an enterprise interested in improving both its financial stability and financial results should strengthen control over production volume planning. In most cases, an increase in the inventory of an enterprise indicates an excess of production.
An increase in stocks in terms of finished products directly testifies to its excess, indirectly - an increase in stocks of raw materials and starting materials, since the enterprise bears the costs for them already when they are purchased. A sharp increase in inventories may indicate an increase in production in the near future, which should also be subjected to a rigorous economic justification.
Thus, if an increase in the company's reserves is detected in the reporting period, it can be concluded that it affects the value of the financial result and the level of financial stability. Therefore, in order to reliably measure the value of the financial safety margin, it is necessary to correct the sales proceeds by the amount of the increase in the company's inventory for the reporting period.
Analysis of the ratio "cost - volume - profit" in practice is sometimes called the analysis of the break-even point. This point is also called the "critical" or "dead" or "balance" point. In the literature, one can often find the designation of this point as BEP (abbreviation "breakeven point"), i.e. point, or threshold, profitability.
Three methods are used to calculate the break-even point (profitability threshold): graphic, equations and marginal income.
At graphic method finding the break-even point (profitability threshold) is reduced to building a comprehensive schedule "costs - volume - profit". The break-even point on the chart is the point of intersection of the straight lines built by the value of total costs and gross revenue. At the break-even point, the revenue received by the enterprise is equal to its total costs, while the profit is zero. The amount of profit or loss is shaded. If the company sells products less than the threshold sales volume, then it suffers losses; if more, it makes a profit.
The revenue corresponding to the break-even point is called threshold revenue . The volume of production (sales) at the break-even point is called production threshold (sales), if the company sells products less than the threshold sales volume, then it suffers losses, if more, it makes a profit.
Figure 1 - Break even point

Equation method based on the calculation of the profit of the enterprise according to the formula:
Revenue - Variable Costs - Fixed Costs = Profit
Detailing the procedure for calculating the indicators of the formula, it can be represented as follows:
(Price per Unit × Number of Units) - (Variable Cost per Unit × Number of Units) - Fixed Costs = Profit.
The method of equations can also be used to analyze the impact of structural changes in a product mix. In this case, the sale is considered as a set of relative shares of products in the total amount of sales proceeds. If the structure changes, then the amount of revenue may reach a given value, and profit may be less. Under these conditions, the impact of a change in the structure on profit will depend on how the assortment has changed - in the direction of low-margin or highly profitable products.
A variation of the method of equations is the marginal income method, in which the break-even point (profitability threshold) is determined by the following formula:
Break even= Composition and content of financial statements: Balance sheet, Profit and Loss Statement. Appointment of financial documents and the possibility of their use in the management system.
The main sources of information for the Finn analysis and adoption of SD are accounting reports (Form 1 - Form 5).
Accounting statements should present an objective and complete picture of the financial position of the enterprise on a certain date. Information compiled on the basis of the rules established by regulatory enactments on accounting is reliable and complete. When forming accounting records, it is necessary to ensure the neutrality of information, i.e. exclusively one-sided satisfaction of the interests of some user groups over others.
Buh balance allows you to get a clear and unbiased idea of the property and financial situation of the enterprise. It reflects the state of the enterprise's funds in monetary terms as of a certain date in 2 sections.
Balance:
1. Property:
According to the composition of investments:
Out-of-turn assets (basic wed-va and intangible assets);
Working capital (inventory, cash, accounts receivable).
2. Finn resources :
According to the sources of formation:
Own capital (section 3 "capital and reserves");
Borrowed funds (sections 4 and 5).
2 interrelated interpretations of balance have become widespread:
1. Subject-material - the composition and location of property is shown in the asset balance, the presence of which is confirmed by the inventory
2. Cost-effective - the balance sheet asset expresses the amount of the enterprise's costs resulting from previous economic operations and financial transactions and the expenses incurred by it for the sake of possible future income; liability reflects the obligations that arose in the process of attracting funds, its interpretation is of a legal nature
All obligations are ranked by law according to the obligation and priority of satisfaction (primarily short-term debt). The economic significance of the balance sheet liability lies in the fact that it reflects the sources of property formation. One of the purposes of the balance sheet is to characterize the change in the financial state of the enterprise for the reporting period.
Balance classification:
1) By sources of information: inventory, book (based on the General Ledger), general (based on the statement);
2) By the time of compilation: introductory, current, liquidation, separation (if there are subdivisions), unification (if merger);
3) By the amount of information: single (1 structural subsection), consolidated;
4) By type of activity: commercial organization, investment fund, bank balance sheet, fear organization balance sheet, budgetary organization balance sheet;
5) By the nature of the activity: the balance of the main activity, the balance of the non-core activity;
6) By form of ownership: state (municipal) enterprise, private enterprise (community, comrade), organizations with foreign investments;
7) Degrees of cleaning the balance from unnecessary indicators: gross, net (net).
Form 2 "Profit and Loss Statement" - data on income, expenses and financial results are presented as a cumulative total from the beginning of the year to the reporting date. Here you will find information about the Finn result, both for the reporting period and for the previous one.
Here are the types of profits:
Gross (difference between sales proceeds and s/s);
From sales (difference between gross and commercial expenses);
Before taxation (from sales + balance from other income and expenses);
Net (after taxation, that is, before taxation-profit tax).
Form 3 “Capital flow statement» - contains information about the amount of capital at the beginning of the period, its receipt and use during the year and reflects the carry-over balance at the beginning of the year.
Form 4 “Cash flow statement”- contains information about cash flows, their receipt, taking into account their balance at the beginning of activities in the context of current, investment and financial activities.
Booking data reporting allow you to identify Fin. position of the enterprise, its solvency and profitability.
1 - Buh. reporting makes it possible to look more deeply into the internal and external relations of households. subject and enterprise, assess its ability to timely and fully pay for obligations.
2 - External users boo. information according to the reporting data, they get the opportunity to assess the feasibility of acquiring the property of an enterprise, avoid issuing loans to unreliable customers, build relationships with existing customers correctly, and also evaluate the financial. position of potential partners.
3 - According to the reporting data, the head of the enterprise reports to the founders and other structures of management and control. A thorough analysis of reporting allows you to reveal the causes of shortcomings in the work of the enterprise, identify reserves and outline ways to improve its activities. That. the importance of reporting is great.
One of the basic terms that any aspiring entrepreneur needs to know is what is the break-even point. Calculating it is extremely important even at the stage of business planning, since without it it is impossible to have a full view of the future business and understand the required volumes of production or services. Consider how the break-even point is calculated, why it is needed and where it is used.
Table of contents:The concept of the break-even point - why you need to determine it

In general, as an economic concept, the break-even point is a situation in which the profit of the enterprise is equal to zero, and total revenues correspond to total expenses. The traditional way to calculate the break-even point is to build a graph, the horizontal axis of which represents the volume of products or services rendered, and the vertical axis represents cash.
On this break-even point chart in the traditional format, you should draw a line of fixed costs that is parallel to the horizontal axis, an ascending line of total expenses and an ascending line of revenue from the sale of products and services. The point of intersection of the line of general expenses with the line showing the income of the enterprise will be the break-even point. Accordingly, with an increase in sales volumes in comparison with the position of the break-even point, the company will make a profit, and if they decrease, it will suffer losses.
Important fact
In English economic theory, the break-even point is called BEP (break-even point), total expenses - TC (total cost), total income - TR (total revenue). In the following formulas and calculations, it is the traditional English terminology that will be used.
Not every modern entrepreneur is aware of the understanding of why you need to know the break-even point of a business. Many of the Russian businessmen do not have an economic education and do not even take into account such basic details that are important when opening and running their own business. Perhaps that is why the percentage of failed enterprises and closing organizations in Russia exceeds the global average.
At the same time, knowledge of the basic terms and principles of economic theory will not require any additional skills or abilities, since it is easy to calculate the break-even point and build a graph in a few minutes. In general, the answer to the question "why do you need a break-even point" can be as follows:
- To determine the feasibility of a particular project as a whole. For example, in some cases, the break-even point may end up being completely unattainable given the existing production capabilities or volumes of services.
- BEP as an indicator can be used if it is regularly reassessed to identify problems associated with the conduct of the economic activity of the enterprise as a whole.
- Drawing up a break-even chart will allow you to visually evaluate and calculate the change in profit and the possible price of a product with a change in sales volumes and vice versa - to understand how a decrease or increase in sales volumes can affect the business.
- Determination of possible critical modes at the enterprise and the use of the break-even point as one of the markers or signaling agents of a crisis situation.
note
Almost always, the break-even point is a general, simplified indicator and does not always correspond to reality when examined in detail. However, this indicator makes it possible to assess the business, its condition and prospects as a whole, giving grounds for a subsequent deeper assessment, if necessary.
How to calculate the break-even point - formulas, calculation procedure

Before proceeding with the calculations of the break-even point, it is necessary to determine all the factors and indicators that will be used in such calculations. So, at least the following indicators will be used in the calculations:
- FC (fixed cost) - fixed costs that are not related to production volumes. These include rent deductions, certain types of taxes and fees, utility bills (partially), employee salaries (also not in all situations), and so on.
- AVC (average variable cost) - variable costs. Such costs include directly the costs of producing one unit of output or providing one specific service. Including, they may include part of the remuneration of employees, the cost of raw materials and related costs, taxes and other similar expenses.
- P (price) - the price of the final product in the form of a good or service that the consumer will pay.
In physical terms, the calculation of the break-even point is as follows:
BEP = FC ( P - AVC )The break-even point in such a calculation formula will demonstrate the required minimum amount of production that the company needs to produce in order to reach the profit margins. Another method and way of calculating the break-even point is its definition in monetary terms. In such a situation, the break-even formula would look like this:
BEP = FC /( C / P )In this case, the indicator C means the profit from the sale of one unit of production from which the total costs of its production are deducted. The fixed costs in the formula are ultimately divided by the profit margin ratio, which allows you to determine the break-even point as the total amount of revenue required to achieve no loss with no profit.
Advantages and disadvantages of the break-even point as an economic tool
The break-even point is a very convenient, and most importantly, a simple economic tool that allows anyone to analyze a business, including those who do not have any economic education.
At the same time, this tool allows you to create models of the future business that are close to reality, adjust sales plans and company costs. However, it also has a number of disadvantages. In particular, they include:
- Lack of consideration of the real dependence of fixed costs on changes in production volumes;
- Ignoring the change in the cost of an individual unit of production, depending on the volume of its production;
- Lack of flexibility and taking into account possible changes in the cost of products within one schedule.
 Of course, these shortcomings can be partially leveled by the development and construction of more complex graphical interpretations of the break-even point. However, the need for complex additional calculations ultimately makes this method inaccessible to most ordinary entrepreneurs without an economic education. Therefore, the break-even point in activities and in its analysis should be used only as one of the tools for control and verification, and not rely entirely on the application of such knowledge and their 100% correspondence to reality.
The break-even point reflects the volume of production, sales of goods and services, which covers all the costs of the enterprise. In an economic sense, this is an indicator of a critical situation when profits and losses are equal to zero. This indicator is expressed in quantitative or monetary units.
The lower the break-even point of production and sales, the higher the solvency and financial stability of the company.
Break Even Point Formula in Excel
There are 2 ways to calculate the break-even point in Excel:
- In monetary terms: (revenue * fixed costs) / (revenue - variable costs).
- In natural units: fixed costs / (price - average variable costs).
Attention! Variable costs are taken per unit of output (not total).
To find breakeven, you need to know:
Fixed costs (not dependent on the production process or implementation) - rent payments, taxes, salaries for management staff, lease payments, etc.
Variable costs (depending on production volumes) - the cost of raw materials and materials, utility bills in production facilities, wages of workers, etc.
The selling price of a unit.
Enter data into an Excel spreadsheet:
- Find the volume of production at which the company will receive a net profit. Establish a relationship between these parameters.
- Calculate the volume of sales of goods at which the break-even point will come.
To solve these problems, we compile the following table with formulas:

- Variable costs depend on the volume of products produced.
- Total costs are the sum of variable and fixed costs.
- Income is the product of the volume of production and the price of a good.
- Marginal income is the total income without variable costs.
- Net profit is income without fixed and variable production costs.
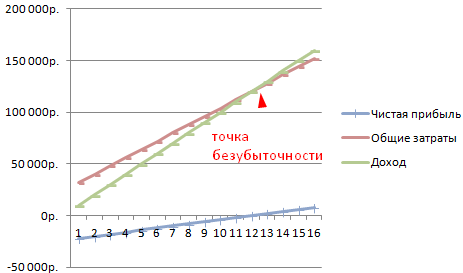
Let's fill in the table and see what output the company will make a "plus" on.

Starting from the 13th production, the net profit became positive. And at the breakeven point, it is zero. The volume of production is 12 units of goods. And the income from sales is 120,000 rubles.
How to Plot a Break Even Point Chart in Excel
To visually demonstrate the economic and financial condition of the enterprise, we will draw up a graph:
- Decide on the appearance of the chart and click the "Select data" button.
- To demonstrate, we need the columns "Total Cost", "Revenue", "Net Profit". These are the elements of the legend - "Rows". We enter manually the "Row name". And in the line "Values" we make a link to the corresponding column with data.
- The range of labels on the horizontal axis is "Production volume".
We get a graph like this:
Let's change the graph (chart layout) a bit.

Such a demonstration allows you to see that the net profit at the break-even point is indeed “zero”. And it was after the twelfth release of products that “plus went”.
Where are such calculations needed?
The break-even point indicator is in demand in economic practice for solving the following problems:
- Calculation of the optimal price for the product.
- Calculation of the amount of costs at which the firm is still competitive.
- Drawing up a plan for the sale of goods.
- Finding the volume of output at which profitability will appear.
- Analysis of the financial condition and solvency of the enterprise.
- Finding the minimum production volume.
Ready-made calculations and templates for analyzing the exit of the enterprise to break even.


- How to close an IP yourself - step by step instructions
- The most prestigious professions
- Job description of the head of the personnel department
- Mollusk type. Class Gastropoda. Bivalve class. Class Cephalopoda. Mollusks are invertebrates
- Ballad genre in Russian literature Ballads read short in Russian
- Story. What is history? What is history scientific definition
- Ballad genre in Russian literature Famous ballads
- Revolts in France The course of the uprising in England and France
- Ostrovsky, "Dowry": analysis and characterization of the characters
- Description of the third part of the third volume of the novel L
- Biography The last years of his life, the death of the poet (Tvardovsky A
- Wise minnow summary
- The meaning of the word neutron The role of the neutron in the fission of the uranium nucleus
- Puppet state of Manchukuo
- Creation of the puppet state of Manchukuo
- the origin of the ancient Russian people
- What is physical space?
- Dyatlov Pass: what really happened?
- What did Stanley Miller's experiment prove?
- Paleolithic Paleolithic Swan Lake